TradingView Tutorial: Complete Beginner's Walkthrough
A complete TradingView tutorial: Super Charts setup, indicators, watchlists, alerts, paper trading, plan limits, and the real-time data catch.

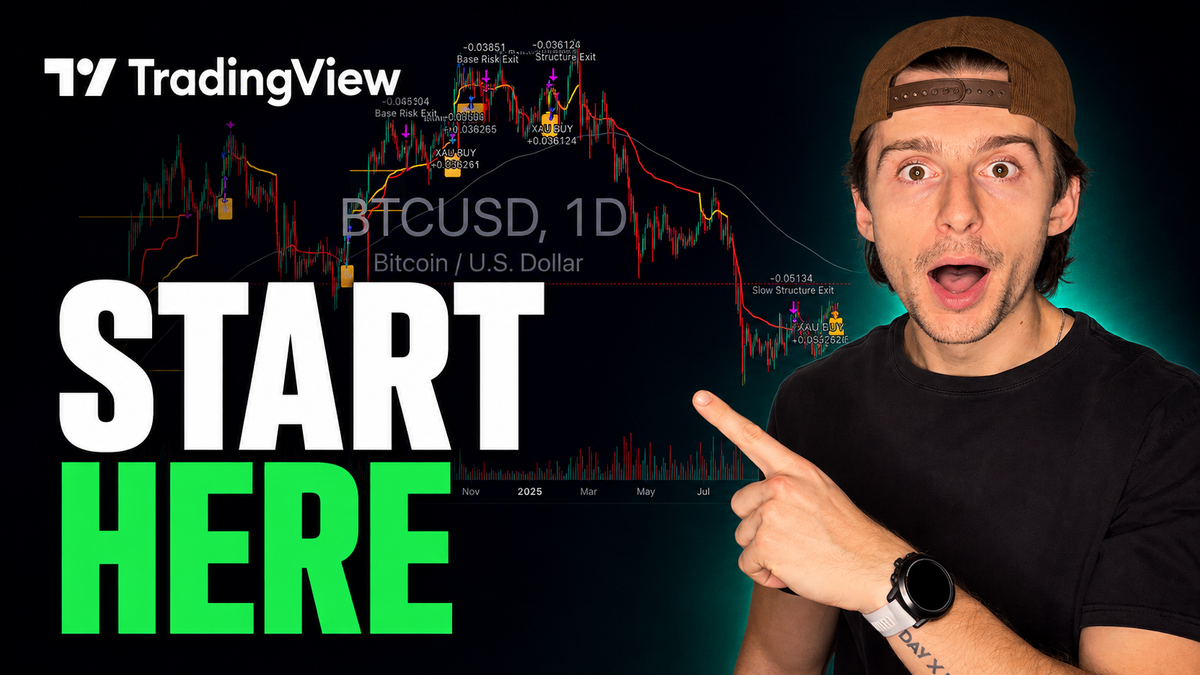
TradingView is one of those platforms where you can open a chart in about 10 seconds — or spend hours getting lost in settings and end up with a cluttered mess that doesn't help your trading at all.
This TradingView tutorial takes you from the moment you sign up to a clean, fully customized layout that actually extracts what you need from your charts. We'll cover finding the right symbol, building your charts, organizing watchlists and alerts, practicing a trade, and deciding whether the free plan is genuinely enough for you.
One thing worth knowing upfront, because it catches people out constantly: buying a paid TradingView plan does not automatically give you real-time data. That distinction can matter far more than which tier you pick.
Let's build this properly, in order.
Table of Contents
- What Is TradingView?
- Prerequisites: What You'll Need
- Step-by-Step: Setting Up TradingView
- Practice Before You Risk Money
- Two Traps That Catch Beginners
- Is the Free Plan Enough?
- The Real-Time Data Catch
- Tips and Best Practices
- Common Mistakes to Avoid
- Frequently Asked Questions
- The Bottom Line
Key Takeaways
- Super Charts is the main product — the terminal that everything else revolves around.
- Orient yourself by the outer edges of the screen: top toolbar, right panel, bottom bar, left tool rail.
- Star everything you use often — timeframes, chart types, indicators and drawing tools all get promoted to a permanent toolbar.
- Name, save and star your layout so TradingView defaults to it every time you log in.
- A useful chart isn't the one with the most tools — it's the one with tools that match how you actually trade.
- The free Basic plan allows 1 chart per tab, 2 indicators, 1 watchlist of 30 symbols, and 3 active alerts.
- Volume profile requires at least the Essential plan. A quad-box layout requires Plus.
- Bar replay plus paper trading is the best free practice tool on the platform — trade historical price action at speed.
- Log scale changes how a chart looks, not what prices are. Know which mode you're in.
- Paid plans do not include real-time data. That's a separate, stacking subscription.
- Black Friday is the cheapest time to buy an annual plan by a wide margin.
What Is TradingView?
TradingView is a charting and analysis platform built around a central terminal called Super Charts. Everything else — screeners, calendars, portfolios, the community, broker connections — orbits around it.
The reason it frustrates beginners is the same reason it's powerful: there is an enormous amount of surface area, and almost none of it is required to get started.
Navigating the Homepage
Land on tradingview.com and the homepage doesn't exactly scream "trading and charts." Scroll and you'll find the market summary, crypto market cap, community ideas, news, and a long tail of other content.
The navigation that matters sits at the top:
| Tab | What's there |
|---|---|
| Products | Super Charts (the main terminal), plus screeners, calendars and portfolios |
| Pricing | Plan comparison — covered in detail below |
| Community | Contests, the indicator marketplace, trading ideas, and published indicators and strategies |
| Markets | Different markets, news and related symbols |
| Brokers | A large list of brokers you can connect and trade live through |
The Community tab deserves a note. You can post ideas, interact with other traders, and browse indicators and strategies other people have published — including grabbing the source code, as long as the script is public and open source. That becomes useful later.
Ignore the rest for now. Click Launch Super Charts.
Prerequisites: What You'll Need
- A free TradingView account. Everything in the setup section works on the free Basic plan except the volume profile indicator and multi-chart layouts, which are called out where they appear.
- A desktop or laptop. This is a multi-panel interface; the mobile app is a companion, not a replacement.
- Roughly 30–45 minutes to work through the full setup at a comfortable pace.
- No brokerage account required. Paper trading covers everything in this guide.
- Skill level: complete beginner. No prior charting experience assumed.
- Optional: the TradingView mobile app, if you want alerts pushed to your phone.
Step-by-Step: Setting Up TradingView
Ten steps from a blank chart to a working research workflow.
Step 1 — Launch Super Charts
Your first launch gives you a fairly clean default layout. It may open with a white background.
To change that: settings icon (top right) → Canvas. From there you can set a solid or gradient background and adjust colors to whatever's easiest on your eyes.
The orientation trick for the whole platform: stick to the outer edges of the page. Every tool lives on one of the four borders, and once you know which border does what, the interface stops feeling overwhelming.
Step 2 — The Top Toolbar
Working left to right across the top:
- Account information sits in the top left corner.
- Symbol search (the magnifying glass) — type any ticker and hit enter. Pulling up SPY, the S&P 500 ETF, is a good first test.
- Timeframes — open the dropdown and star the ones you use. Starred timeframes appear permanently across the top. Note that tick-based intervals require a paid plan.
- Chart types (the candlestick icon) — same idea. Star candles, area charts, or whatever you prefer, and they're always one click away.
- Indicators — a massive searchable library. Star your favorites. Community indicators include a "learn more" option and, where published open source, the source code.
- Alerts — create alerts by price or volume, set the parameter (crossing up, crossing down and others), add conditions, then configure trigger, notification and expiration.
- Replay — rewind the chart to any point in history and play price action forward at adjustable speed. This is one of the most underused features on the platform.
- Layouts — manage, rename, download, save and share your chart layouts.
Do this now: name your layout, save it, and star it. Starred layouts appear under the circle icon and TradingView will usually default straight to it when you log in.
Two more icons on the right side of the top bar:
- Settings — everything cosmetic and structural: chart appearance, colors, scales, and pre-market, post-market and overnight session display.
- Trade — connect a broker and trade live through TradingView. If you live in the platform anyway, connecting a broker like Interactive Brokers lets you manage positions and execute without leaving your charts.
If you're not ready to connect real money, click the paper trading icon instead. Your paper account then appears in the bottom left.
Click the trade icon again and the trading panel opens. You can toggle between the standard order panel and depth of market (the price ladder). Buy market, sell market, flatten, adjust size — it's all there, in paper money.
A practical use even if you execute elsewhere: map out a trade visually. Set your risk at a recent low, set your target overhead, and at 100 shares the panel shows exactly what you're risking and what you stand to make. It's a fast sanity check whether you're trading stocks, futures or crypto — then go execute wherever you actually trade.
Step 3 — The Right-Hand Panel
Top to bottom down the right edge:
| Icon | What it does |
|---|---|
| Watchlist | Your symbol lists |
| Alerts | Every alert you've set |
| Object tray and data window | Chart object management |
| Messages | Public and private messages |
| Screener | Opens the TradingView screener in the side panel |
| Pine editor | Write or edit Pine Script strategies and apply them to charts |
| Calendar | Economic news, earnings, dividends and IPOs |
| Option chain | Browse and paper trade options |
| Community | Trading ideas, community posts, indicators and strategies |
The Pine editor is worth flagging. If you have a strategy — written yourself or generated with AI — you can load it, click Add to chart, and it appears as an indicator or strategy in the top left while a full backtest populates along the bottom.
Step 4 — The Bottom and Left Edges
Hover over the chart and two letters appear in the bottom right:
- A — auto-fits the data to your screen, so scrolling back through history keeps price action properly framed.
- L — switches to a logarithmic scale. More on why this matters below.
Also along the bottom: adjust data for dividends, a time zone setting, your time intervals, and the paper trading button, which opens your account with history, orders and balances.
Down the left edge live all the drawing tools. The trend line tool is the obvious starting point, and every tool group has a small arrow that expands to reveal similar tools.
Star the tools you use and they collect into a movable toolbar you can position anywhere on screen. A practical minimalist set:
- Horizontal line
- Horizontal ray
- Rectangle
- Long position and short position tools
- The measure tool
Then save your layout again so none of this is lost.
Step 5 — Add Your First Indicator
Before adding anything, a principle worth internalizing: a useful chart is not the one with the most tools on it. It's the one with tools that are genuinely useful to how you trade.
If you're a swing trader looking at the bigger picture, one-minute candles and short-timeframe indicators are noise. Build for your actual style, not for how someone else's chart looks.
A strong first indicator for big-picture traders is the Visible Range Volume Profile (VRVP). Search "VRVP" in the indicators list and add it.
Once it's on the chart, hovering over its label gives you:
- Settings — full customization
- Trash — delete it entirely
- Three dots — additional options
- Eyeball — hide and show it without deleting it
Inside settings, a few adjustments that make it far more usable:
- Style → width: the default extends too far across the chart. Drop it to 15–20%.
- Colors: setting up volume and down volume both to white keeps the focus on overall volume rather than directional noise.
- Visibility: you can hide an indicator on specific timeframes. Turn it off on the daily and it still appears everywhere else.
- Inputs → value area volume: set to 100 so the whole profile renders visibly.
- Row size: the default of 24 is coarse. 50 produces a much finer, more readable profile.
That visibility setting is the underrated one — it lets you keep an indicator without it cluttering every timeframe you switch to.
Step 6 — Multi-Chart Layouts
The layout selector at the top lets you split into two charts, four charts, and beyond.
The thing that trips people up: when a layout is split, a thin white outline shows which chart is active. Any indicator you add or symbol you change applies to that box. Click into the box you want before doing anything.
A faster way to change symbols: click into a chart and simply start typing a ticker. No need to open the search — type "IWM," hit enter, and it loads.
A quad layout is excellent as a side-screen monitor — oil, rates, crypto and the S&P at a glance, so you notice if something dramatic happens. It's generally poor as your primary analysis layout, because four charts at once is too much visual noise for real decision-making.
Note the plan limits here: Basic allows one chart per tab, Essential allows two, and you need Plus for a four-chart quad box.
Step 7 — Mark Your Key Levels
With a single chart back up, use your starred drawing tools.
The brush is useful mainly for explaining ideas to other people — circling lows, pointing out patterns.
The real work is horizontal lines at key levels. Mark your significant swing lows and the recent all-time high. These become the areas where you watch price reaction, and you'll often find a level proves itself in real time — price approaches, bounces, and confirms it was worth marking.
Save the layout. Turning on autosave means you stop thinking about it.
Step 8 — Build a Watchlist
Open the watchlist panel and use the dropdown to Create new list. Name it and click create.
The plus icon adds symbols. But there's an important detail most tutorials skip: watch which category tab you're on.
By default you're under All. Search a ticker and you'll see results spanning stocks, funds, futures, forex and crypto. Search "SPY" under Stocks and you get SPY — but scroll and you'll find SPY D, SPY B, SPY C and SPY R as well. Under Funds you get different information again.
Getting this wrong is easier than it sounds, which brings us to one of the two traps covered below.
Step 9 — Use the Screener
When you don't already know what you want to trade, the screener finds it for you.
Open the screener tab and set your parameters — a long momentum screen, for example. Building a good screen takes time, but you only do it once.
Results populate as a list. Click any name and it loads on the chart. Minimize the screener for a clearer view, evaluate it, and add it to your watchlist if it's worth tracking.
That's the discovery half of the workflow: screen for candidates, keep the good ones.
Step 10 — Set Alerts
Alerts turn a watchlist into something that works while you don't.
Three ways to create one:
- Right-click on the chart (control-click on Mac) → scroll to Add alert on [symbol]
- The alerts icon in the top toolbar — same destination
- On a drawing. Click a line you've drawn and a small toolbar appears with thickness, appearance, settings and an add alert icon.
That third method is the most useful. Setting an alert directly on a horizontal ray means you get notified when price actually reaches the level you care about, not an arbitrary number.
Configure it:
- Condition: crossing up, on the horizontal ray
- Trigger: only once, if you just need the first touch
- Expiration: open-ended, so it waits indefinitely until it fires (this requires a paid plan — free alerts expire after one month)
- Message: customize what it says, so the alert itself tells you what to do
- Notifications: play a sound, send a desktop notification, or notify in app
That last option is why the mobile app is worth installing. With app notifications on, alerts reach your phone home screen the moment they fire.
Click create and a small blue alert icon appears on the line, confirming it's active.
You now have a complete research workflow: screen for stocks, add them to a watchlist, and set alerts that tell you when to look. That's the whole loop.
Practice Before You Risk Money
Setup is only half of it. The other half is knowing the platform won't betray you at the moment of execution.
Paper Trading the Order Widget
Before you connect a live brokerage account, practice with paper trading — specifically to learn the order widget itself.
The failure mode is genuinely common: you connect a broker like Webull or NinjaTrader, start trading futures through TradingView having never used its order panel, and go short when you meant long — or trade five contracts instead of one.
That's an entirely avoidable, entirely self-inflicted loss.
Open Trade → paper trading and you'll see positions, orders, history and balances. Click trade again to open the order widget, where you can toggle between depth of market and standard order entry.
Bar Replay Plus Paper Trading
Here's the combination that makes TradingView genuinely valuable as a training tool, and it works on the free plan.
Pair bar replay with your paper trading account.
- Open Replay → Start new and pick a point in history. Going back to the 1990s on SPY is a reminder of how young some of these instruments are.
- Zoom in and open the trade panel. Replay trading populates in the bottom right.
- Click play and price action unfolds day by day. Drop the speed to 0.2 for a slower read, or accelerate it when nothing's happening.
- Place a real order. A limit buy, a stop loss at the recent swing low, a take profit at a level overhead, sized at 100 units.
What follows is the actual value. The order sits unfilled, showing potential profit and loss if it triggers. Price approaches, misses, and you face a real decision: wait, or adjust the order upward. A gap down fills you. The position runs very close to your stop, recovers, moves toward target — and then stops you out anyway for a $194 loss.
Every fill appears along the bottom, along with running P&L for the account.
The recommended practice routine: pick a historical window matched to your style — a week for a day trader, a year for a swing trader — and trade it exactly as you would live. Turn the speed up and you can compress an hour of screen time into a meaningful sample, then look at how many trades were profitable and what your profit factor was.
It's practice at fast-forward, with no waiting for live conditions. Perfect for weekends, evenings, or any time the market is closed.
Backtesting a Strategy
Beyond discretionary practice, you can test a rules-based strategy.
Find one in the Community → Indicators and Strategies section. Filter to Strategies with open source only so the code is visible. Click into one, review the source, and hit Use on chart — it loads into the Pine editor. Then Add to chart.
A full backtest populates along the bottom, showing:
- Profit factor
- Percentage of profitable trades
- Maximum drawdown
- Net profit
You can change the symbol to see how the same logic performs elsewhere, and open settings → properties to adjust starting capital, timeframe, position sizing and commissions.
One caveat that matters enormously: a great-looking backtest and a realistic one are not the same thing. Wrong settings produce results that will never replicate live. Treat the numbers as a starting point for investigation, not a verdict.
Two Traps That Catch Beginners
Both of these cost people real money and neither is obvious.
The Log Scale Illusion
Remember the L toggle in the bottom right. It switches between linear and logarithmic price scaling, and the visual difference can completely change your read on a chart.
MRNA is a clean example. On a standard scale after a big move, the stock looks nowhere near its 2021 high. Switch to log scale and suddenly it looks strong.
Why? On a log chart, the distance from $10 to $150 can occupy the same space as $150 to $500. The proportions are consistent, but the visual is compressed in a way that flatters or flattens moves depending on where you look.
Log scale doesn't change the prices. It changes what your eyes conclude. Always know which mode you're in before drawing conclusions about how far something has run.
Ticker Symbol Collisions
The same ticker can mean two completely different things.
ES is the E-mini S&P 500 futures contract. ES is also Eversource Energy, trading on the NYSE.
Type it into search and you might pull up either one. If you're not paying attention to which classification tab you're on, you can add the wrong instrument to a watchlist, chart the wrong asset, and analyze something you never intended to trade.
Check the category tab every time you add a symbol — especially with short tickers and anything that overlaps between stocks and futures.
Is the Free Plan Enough?
For a lot of people, honestly, yes. But you should know exactly what you're giving up.
What the Free Basic Plan Limits
| Limit | Basic (free) |
|---|---|
| Charts per tab | 1 |
| Saved layouts | 1 |
| Indicators per chart | 2 (volume counts toward this) |
| Watchlists | 1, capped at 30 symbols |
| Active price alerts | 3 |
| Alert expiration | 1 month maximum |
| Tick, second and custom intervals | Not available |
| Volume profile indicator | Not available |
| Bar replay | Available, but no minute, second or tick data |
| Historical annual data | 7 years (20 on paid plans) |
| Quarterly financial data | 8 years |
| Simultaneous connections | 2 |
| Historical bars | 5,000 |
| Webhook notifications | Not available |
| Ads | Yes |
A few of these bite harder than they look. Two indicators per chart including volume means the setup built earlier in this guide — volume profile plus volume plus a strategy — already exceeds the free tier. And volume profile requires at least Essential, which is almost certainly deliberate.
If none of that breaks what you need, use TradingView for free. It's a genuinely capable free product.
Which Plan Fits Which Trader
| Plan | Who it's for |
|---|---|
| Basic (free) | A light user who wants a simple single-chart workflow and a place to start |
| Essential | The next step up — a few extra capabilities and no ads |
| Plus | An active beginner who wants more capability without the Premium price |
| Premium | A power user with many alerts and webhooks who uses the platform constantly and can justify the cost |
| Ultimate | Premium taken further — unnecessary for the vast majority of traders |
The jump from Essential to Plus isn't dramatic. The real value step is Premium, which adds second-based intervals, volume footprint charts, non-expiring alerts and webhooks.
Webhooks deserve explanation. A webhook lets an alert, when it fires, send a signal somewhere else — to an automation, a trading bot, an AI system. That's what turns TradingView from a charting tool into the trigger for an automated workflow. Notably, webhooks are available on Essential too, not just Premium.
The combination that justifies Premium for an automation-minded trader is webhook alerts that never expire — set a strategy running in the background and genuinely forget about it.
On pricing: the rates advertised assume annual billing. Month-to-month starts around $14.95/month at the low end and climbs past $239/month for Ultimate. Paying annually for Premium works out to roughly $60/month.
The honest filter: if you can't clearly see how Premium helps you, don't buy Premium.
How to Save Money on TradingView
Two stacking savings, and the second is much larger than the first.
First, the affiliate discount. Using the referral link below the video saves $15 toward any paid plan — effectively a free month if you're starting on Essential monthly. You can grab that discount here.
Second, and far bigger: wait for Black Friday. TradingView runs a substantial annual sale — discounts reported as high as 50% and even around 70% on Premium and Ultimate tiers in past years.
The optimal play:
- Start on the free plan, or a monthly plan if you need more right now
- Wait for Black Friday
- Buy the annual plan during the sale
Annual billing already saves up to 17% on its own. Stack the Black Friday discount on top and the difference is significant. Renewing every year during Black Friday week — buying the next twelve months at the deepest discount available — is the cheapest way to hold a paid plan long term.
Disclosure: the TradingView link is an affiliate link and supports the channel. The Black Friday advice applies whether or not you use it.
The Real-Time Data Catch
This is the part that generates the most confused comments, and it's the single most important thing in this guide.
Paying for a TradingView plan does not give you real-time market data. Data is a separate subscription that stacks on top of your plan cost.
Find it under Products → Market Data.
Typical costs for a US-focused trader:
- US stock market bundle — real-time data for essentially all US-listed stocks
- CME, CBOT, COMEX and NYMEX — roughly $7/month, covering futures data
How to tell if you're on delayed data: look for a small "D" next to the symbol on your chart. Click it and TradingView explains that you're on delayed data and need to pay for live.
Do you actually need it? Often, no. If you chart in the evenings, before work, or on weekends and do big-picture analysis, delayed data is fine. Your broker almost certainly provides live data at the point of execution. Analyze on delayed data, execute on your broker's live feed — that's a completely valid, free workflow.
If you want live data all the time regardless, budget the extra few dollars a month and know it's an addition to your subscription, not part of it.
Tips and Best Practices
- Star aggressively. Timeframes, chart types, indicators and drawing tools all get promoted to permanent toolbars. This is the single biggest speed improvement available.
- Turn on autosave so layout work is never lost.
- Use indicator visibility settings to hide tools on timeframes where they add nothing.
- Keep one clean analysis layout and one busy monitoring layout. Don't try to make a single layout do both jobs.
- Set alerts on drawings, not arbitrary prices. The level you drew is the level you actually care about.
- Install the mobile app and enable in-app notifications so alerts reach you away from the desk.
- Practice with bar replay before every new strategy, not just once when you're learning the platform.
- Check the log scale toggle before concluding anything about how far a stock has moved.
- Confirm the category tab whenever you add a symbol with a short or ambiguous ticker.
Common Mistakes to Avoid
- Assuming a paid plan includes real-time data. It doesn't. Budget separately.
- Building a cluttered chart because someone else's looked impressive. Match your tools to your timeframe and style.
- Trading live through an order widget you've never practiced with. Paper trade the interface first.
- Adding indicators to the wrong chart in a split layout. Click into the outlined box first.
- Forgetting to name and save a layout, then rebuilding it from scratch next session.
- Charting the wrong instrument because two things share a ticker.
- Reading a log chart as if it were linear.
- Trusting a backtest at face value. Wrong settings produce results that never replicate live.
- Buying Premium at full price in, say, March instead of waiting for Black Friday.
Frequently Asked Questions
Is TradingView free?
Yes. The Basic plan is free and genuinely usable, with limits of one chart per tab, two indicators per chart, one 30-symbol watchlist and three active alerts. Alerts expire after one month and you'll see ads.
What is Super Charts on TradingView?
Super Charts is TradingView's main charting terminal — the primary product that screeners, calendars, portfolios and broker connections all revolve around. You reach it from the Products tab.
Does a paid TradingView plan include real-time data?
No. Real-time market data is a separate subscription that stacks on top of your plan. A US stock bundle and a futures bundle covering CME, CBOT, COMEX and NYMEX (around $7/month) are the common additions. A small "D" next to your symbol means you're on delayed data.
How much does TradingView cost?
Advertised prices assume annual billing. Month-to-month starts around $14.95 and rises past $239 for the Ultimate tier. Premium billed annually works out to roughly $60 per month.
Which TradingView plan should I buy?
Basic for a light single-chart user, Essential to remove ads and add a little capability, Plus for an active beginner who wants up to four charts, and Premium for a power user relying on webhooks and non-expiring alerts. Ultimate is unnecessary for most traders.
Can I get volume profile on the free plan?
No. The volume profile indicator requires at least the Essential plan.
How many charts can I have on one TradingView layout?
One on Basic, two on Essential, and four on Plus — so a quad-box layout requires the Plus plan or higher.
What is TradingView bar replay?
A feature that rewinds the chart to any historical point and plays price action forward at adjustable speed. Paired with a paper trading account it becomes a full practice environment. It's available on the free plan, though without minute, second or tick data.
Can I paper trade on TradingView?
Yes. Click the paper trading icon to connect a simulated account with positions, orders, history and balances, and trade through the same order widget you'd use with a live broker.
What is a TradingView webhook?
A webhook sends a signal to an external service when an alert fires, letting you connect TradingView to an automation, trading bot or AI system. Webhooks are available on the Essential plan and above.
When is the cheapest time to buy TradingView?
Black Friday. The annual sale has reached discounts of 50% and higher on Premium and Ultimate tiers. Combined with the standard annual discount of up to 17%, buying your yearly plan during Black Friday week is the cheapest approach.
Can I connect my broker to TradingView?
Yes. TradingView supports a large list of brokers through the Brokers tab and the trade icon, letting you manage positions and execute orders without leaving your charts.
The Bottom Line
Work through this guide and you can find an idea, build a clean chart, organize it into a real workflow, set alerts that reach your phone, and practice trades without risking a dollar.
The five things that matter most:
- Orient by the edges — top, right, bottom, left — and the interface stops being overwhelming
- Star everything you use often and save a named layout
- Build for your trading style, not for how impressive the chart looks
- Practice the order widget in paper trading before connecting real money
- Budget for real-time data separately if you actually need it
The natural next step is questioning whether the strategy behind your trades holds up. TradingView will happily produce a beautiful backtest — but the wrong settings generate results that never replicate in live trading. That's worth understanding before you act on any backtest you run.
Ready to set it up? Start with TradingView here — the free plan covers everything in this walkthrough except volume profile and multi-chart layouts, so there's no reason not to build your first proper layout today.
Watch the full video tutorial here: